Morten
-
Posts
215 -
Joined
-
Last visited
Everything posted by Morten
-

Map Editor truncating map extension on ocean side?
Morten replied to Pablo Faúndez's topic in Map Editor
I was testing my above method and need to correct myself. It seems like the map editor does not save information about the adjusted map size to file. so I guess thise merely was intended as a way to enlarge the 'canvas' while 'painting' roughness-change lines and elevation contours manually. In most cases you can use the methods inside WAsP and WAsP Engineering as described in my post above, but not for the Prepare data for WAT tool inside WAsP Engineering. The trouble is that this tool will ask you for a WAsP vector map file and then do some WAsP calculations for mean wind climates. As you can imagine, this can fail if the map does not include an offshore wind farm. A work-around method is to open the map in the map editor adjust the map size to include the wind farm create a dummy roughness line as a polygon surrounding the offshore wind farm specify water surface roughness both inside and outside that polygon. Load the map with the amended map into the Prepare data for WAT tool and its WAsP calculations should work without problems. -
Map Editor truncating map extension on ocean side?
Morten replied to Pablo Faúndez's topic in Map Editor
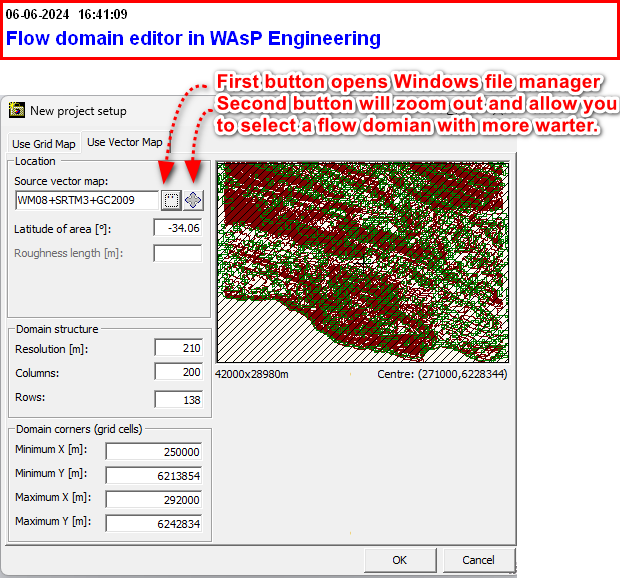
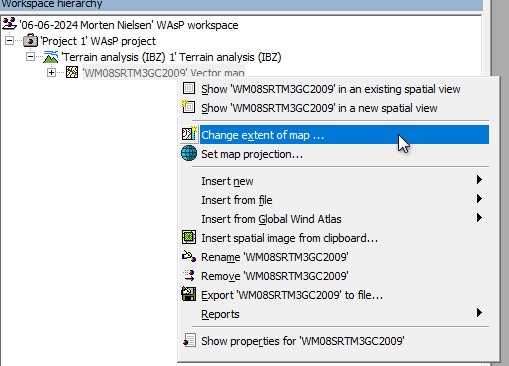
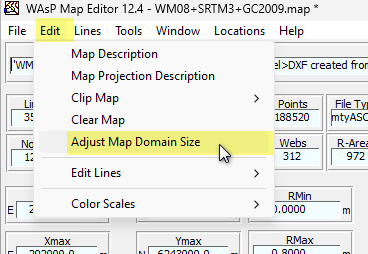
The map editor limits the map domain as you describe, because it does not know for sure how far the water surfaces extends into the unknown. However, you can select Edit> Adjust map domain size in the main menu of the Map Editor main window (not the Map display window) and extend the map domain size manually. As an alternative, you can extend the map from inside WAsP. For this you right-click the vector map in the object hierarchy and select Change Extend of map from the popup menu. The domain editor of WAsP Engineering program generates a grid map based on your vector map. For coastal or offshore sites, we sometimes need to extend that map in the offshore direction. For this you first zoom out the displayed vector map and then you can select a grid map with more extend in the offshore direction. The zoom button in the WAsP Engineering domain editor window is the second one next to the line with the name of the vector map, see below.
-
Terrain Grid Data disappears when adding Turbines to WAT
Morten replied to Rainer Cordsen's topic in Windfarm Assessment Tool
... I saw, your second post. I am not sure what happened, but this error is probably related to the first one, and difficult to reproduce in the latter session. -
Terrain Grid Data disappears when adding Turbines to WAT
Morten replied to Rainer Cordsen's topic in Windfarm Assessment Tool
Hi Rainer, Thank you for reporting this. I assume that you are using the new WAT 4.7, and I also used this for testing. Your method is correct, and I don’t think you misunderstood anything. I can reproduce the first reported problem, where the map is placed outside the project tree. Furthermore, WAT gives error messages when I try to move it or delete it. This is clearly wrong and something which needs fixing. You wonder whether the error affects the results. The terrain elevation data are used for evaluation of terrain complexity and thereby the Cct factors and turbulence results. If the map is missing WAT will use the maximum Cct factor of 1.15. In my test, the misplaced map object does not affect the results at first, but when I select new turbine sites, WAT found the map object even though it was misplaced. Maybe you can use this as a temporary work-around, while waiting for an amended WAT version. To check the Cct used for the turbulence calculations you can look at Reports for selected turbine> Terrain complexity. I do not fully understand the second reported problem where you imported two sets of WAsP/WEng data and observed NaN values for effective turbulence results. Most likely the data were not imported correctly, but I you like me to check, then please send the resulting WAT project as an attachment of a mail to waspsupport@dtu.dk. You do not need to explain much, just refer to this discussion thread. Cheers, Morten -
Mert sent us some WindPro and WAsP project files demonstrating these wake loss difference. Thanks for this, it is always easier to discuss possible problems when we have test data! My former DTU colleague Tobias Ahsbahs, now working for the WindPro developers at EMD, spotted that the Ct curve used in WAsP project was much lower that the Ct curve in the WindPro project. We all agreed that this must be the reason for the different wake loss predictions.
-
We rewrote the homepage, so the WAT AEP link is changed to https://www.wasp.dk/software/windfarm-assessment-tool/wataep. It does not explain that much about the models, but I once made some videos about this for DTU students The latest WAT version enhanced the AEP model with an option for different uncertainties and technical losses for individual turbine groups, see Windfarm Assessment Tool version 4.7 released - WAsP
-
Hi Mert, The implementation of the wake models in WAsP and WindPro are independent, so it is quite possible that the programmers made different choices. I made a third implementation in WAT and compared it with WAsP. The agreement was reasonable in flat terrain, but the differences were larger than expected in complex terrain. This must be because I handled speedup and deflection between the wind at the wake-shedding and wake-exposed turbine sites differently. Other reasons for model deviations could be the number of calculated wind directions within each wind sector the interpolation in the power and thrust-coefficient curves when looking up data for a speed-up corrected wind speed - especially near the cut-in wind speed possible air-density correction of the thrust-coefficient curve in WindPro? - we decided to ignore this in WAsP and WAT So you see, even though the PARK 2 model is really simple, there are undocumented details, which programmers might handle differently. Kind regards, Morten
-
Please help me with a Problem 'Ln: Invalid non-positive argument: ??'."
Morten replied to Jonathan's topic in Climate Analyst
I wonder whether Jins and Johnathan is the same person? Anyway, it is best to discuss technical issues like this via WAsP - Support. -
The short answer is no - WAsP does not present local wind climates in this form. WAsP prefers to use a Weibull distribution and frequency of occurrence for each sector. It is relatively easy to calculate bin frequencies from the Weibull parameters and I can send you the formula, if you like. WAsP wind statistics are available in the turbine site view - right-click the site and select show> wind for an example. It is also available in various reports and tools> utility scripts. Try to find a report or script which suits you - e.g. tools> utility scripts> custom windfarm output file - but beware that the precision (number of digits) often is less than ideal. If you need these matrices in a specific format for many projects, you may want a programed solution. There are several options: Get a PyWAsP license, see WAsP - PyWAsP. Create your own utility script. This requires visual basic programming skills and the typecasting can be tricky. It is usually better to tweak an existing script than to start from scratch. Read the data from the WAsP workspace file. This is actual a zip folder containing a file called inventory.xml, which has objects called <PredictedWindClimate>. Please note that the workspace file must be saved in a state where all calculations are valid.
-
I am not sure, but this might have something to do with the map projection. More details in my answer in the WAsP support system.
-
I read your post via Google translate. I suggest that you start by checking the wind resource at your site via Global Wind Atlas. If this is promising, then contact a local wind energy consultant in Turkey. Maybe (3) Ferhat Bingöl | LinkedIn, who is a professor at Izmir Institute of Technology, can guide you in the right direction.
-
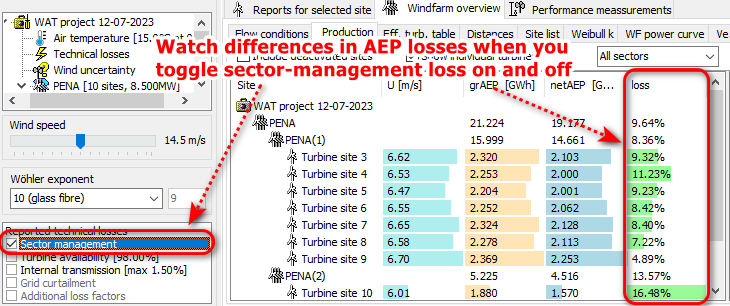
AEP losses in WAT production result tables include wake effects and additional technical losses selected in the check-box list under the object hierarchy on the left-hand side of the WAT GUI. The best way to detect the effects of specific technical losses is to compare result tables for different selections of technical losses. Doing so, you will discover that loss components do not add completely linearly. That is why they are not reported separately in WAT. In complex terrain, the background turbulence for individual turbine sites is multiplied by individual Cct factors and the IEC standard tells us to use the same factor for all directions. However, the effect on wake turbulence from neighboring turbines is different, so the effective TI will not be quite proportional to the Cct factor.
-
You need to pose this question to the WindPro helpdesk. I think that it will be possible to merge time series from alternative anemometers, but I am not sure whether this is done in the METEO or maybe the MCP module.
-
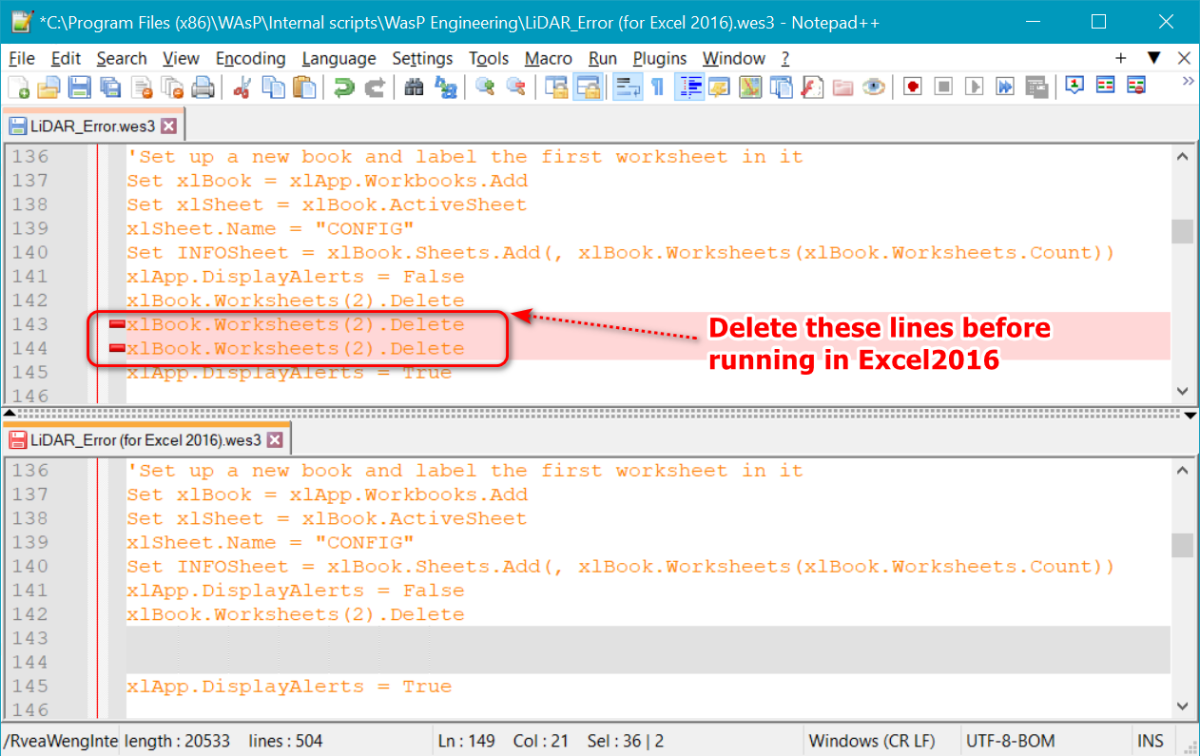
Thank you for posting this. I forgot that I once made my own update of this script (tested by Excel 2016), where the difference between "GetObject" and "CreateObject" was not an issue. However, I had to delete two line which tries to remove extra worksheets. The reason is that Excel 2016 by default opens with only one blank worksheet, while earlier version used to open with three blank worksheets.
-
Creating new scripts for WEng can be complicated, but modifications of an existing script is feasible. Video demonstration no. 8 at https://panopto.dtu.dk/Panopto/Pages/Viewer.aspx?pid=686617ee-3a81-4381-9082-af9400ec5924 explains where these scripts are stored and how to make simple modifications. I never tried modifying the Lidar error script, but it seems like lines 63-70 defines the parameters for the calculations. Here, it seems like WDstep=12 determines the directional increment of the displayed table, so try to reduce this to 10. You should also be aware that the ConAngle and Step parameters represents the cone angle and horizontal angle between measurement points in the Lidar scanning pattern. Please check whether these parameters are correct for the Lidar you are using. Also note that the length of the parameter arrays near line 261-264 of the script, e.g. Dim nx( 60), must equal to the number of measurement points = 360/step. Thus, if you define Step=5 instead of 6, you should modify array dimensions, e.g. Dim nx( 72). If a script fails, it will not tell you what the problem was, so it is often better to test after small incremental change, rather than changing everything before the first test run.
-
The "wind speed and deflection script" lists speedup factors and deflection from a reference mast to a turbine site, with possible height difference, for a number of wind directions. This is probably not what you need. The idea of the 'Lidar Error' script is to simulate flow components along a number of lidar beams by flow solutions of WEng, combine these components as the lidar would do and, finally, compare the combined lidar response with the horizontal wind at the Lidar position. We used to distribute this script with the attached PDF file, and the basic research is described in an article available at Modeling conically scanning lidar error in complex terrain with WAsP Engineering — Welcome to DTU Research Database The lidar error will mostly depend on the flow-line inclination at the measurement points, the number of lidar beams, and their angle from zenith. The method works reasonably well with moderate terrain complexity but less so in really complex terrain, since the linear flow model of WEng cannot predict flow separation. The script calculates for two classic lidars, but it might be possible to modify it script for another lidar types, if you know the cone angle and number of beams. I think some lidars offers a similar correction internally in the instrument, so please make sure only to apply the method on data which are not already corrected. LiDAR_Error_Manual.pdf
-
WAsP engineering (WEng) has three methods for calculating extreme wind climates Annual maximum method (AM) Peak over threshold method (POT) Spectral correction method (SCM) The first two methods works with an observed extreme wind climate (OEWC) at a reference site prepared by the WAsP Climate Analyst (WACA) program. There are two variants of the OEWC since the data for the two methods are sampled differently, either supporting annual extremes or storms above a threshold with a suitable storm separation period. The OEWCs are converted to GEWC by WEng, using flow modelling and geostrophic drag law, similar to the wind atlas method in WAsP. Both OEWC and GEWC objects stores extreme-wind candidates for several directions, since the speed up from reference site or generalized conditions to individual turbines site will depend on direction, and we do not know, which candidate wind will be most extreme at individual turbine sites. Finally, the Gumbel distribution is fitted to local AM or POT extremes wind at the turbine site and used for extrapolation to a fifty-year return period. The Gumbel fitting method for POT is fairly conventional. For AM we use a fitting method based on probability-weighted moments. The SCM method is based on reanalysis data, which we store on a server. The data coverage is not yet global, but we are working on it. The length of the reanalysis data is 20 years, which is good for extremes, but reanalysis data are too smoothe in time and space, so direct application would underestimate the extremes. We corrected this error in spectral space, by a combination of the reanalysis spectrum for low frequencies and a high-frequency spectrum of local 10-min data from a mast. The extremes are calculated by moments of the combined spectrum. You can prepare the 10-min time series by WACA. I generally recommend the SCM method when supported by our data base, and AM as an alternative if you have local observations from 5+ years. I do not recommend the POT method (in WEng), because our sampling method applies a threshold for the reference mast data and not at the turbine site. WEng POT will generally not converge to a Gumbel distribution for turbines in complex terrain, unless all the extreme winds comes from the same direction so we avoid directional variation in speed up from mast to turbine site. WAT input is usually created by the Prepare data for WAT tool inside WEng. The mean wind climate for this is calculated by a WAsP DLL. Thus, WAT applies a mixture of data from WAsP and WEng. WAT recalculates turbine-specific Vave values by sector-wise Weibull distributions coming from WAsP. WAT applies the Ve50 values from WEng and sometimes make a the correction by Ve100 value, as specified in edition 4 of the IEC 61400-1 standard. Simple question - long explanation.
-
There are some sample data at 'C:\Program Files (x86)\WAsP\Samples\WACA sample files.zip'. Actually, WACA can read several ASCII file formats. The data inside the file must be arranged with datetime, speed and direction in columns, and one record per line. Sometimes the date and time are split over several columns, but it does not have to. I would try the CVS file first and maybe send a sample to WAsP support if WACA cannot import it.
-
I suppose that WEng4 is still compatible with WAsP 11, but we only sell WAsP Engineering as part of the WAsP bundle, so I recommend that you upgrade to WAsP 12 to take advantage of the latest model changes in WAsP. You can read about the cost and order from Wind energy industry-standard software - WAsP. It has been some years since we switched to the WAsP bundle license with yearly subscription, and I am not sure whether you still can avoid the first-year sign up fee as an existing WAsP 11 user. Maybe you should ask about this in a mail to our sales office at wasp@dtu.dk
-
Hi Hardik, A linear flow model, as the one used by WEng, will predict nearly mirrored inflow angles for opposite directions. The directional average will be close to zero even for high inflow angles in individual sectors, which sounds like a bad compliance check. I therefore decided to let WAT calculate the energy-weighted average inflow angle by absolute values of sector-wise inflow angles. The design-load case for IEC 61400-1 wind-turbine classifications specifies positive inflow angles for load simulations. Thus, for site assessment, it could make sense to ignore all negative inflow angles or maybe calculate averages of positive and negative inflow angles as two independent measures. Let us hope that future versions of the IEC 61400-1 standard will be more specific about this site-compliance check.
-
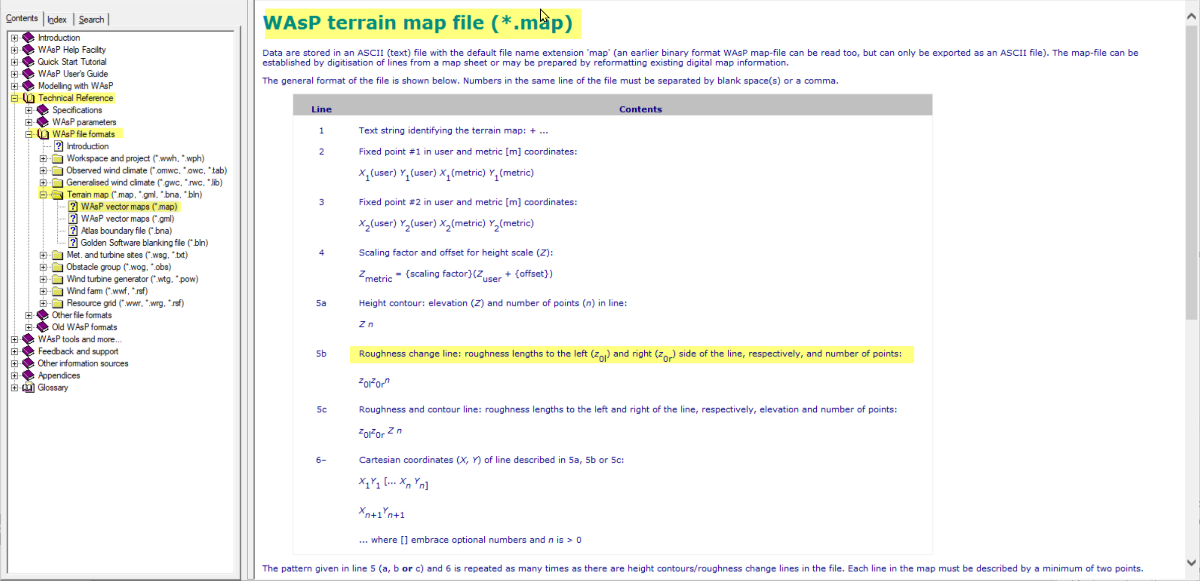
The WAsP map format is documented in the WAsP help file section Technical reference>WAsP file formats> Terrain map>Wasp vector map. The line in your map file where the reported error occurs seems to be the header of a roughness changes line, which specifies a 13 points with z0=0.1m on the left-hand side and just a question mark for the surface roughness on right-hand side. Question marks are not allowed, hence the error. Try to open the problematic map file in a normal ASCII editor and search for question marks. If the file is full of them, then you probably have to import the shape file again. If you only find a single or a few lines with this problem, then try to first edit them in the ASCII editor. Maybe replace the question mark with a real but very unusual z0 value like '0.1000 10.0 13' instead of '0.1000 ? 13'. Then save and open the file in the WME and correct the problematic surface roughness value here.
-
It worked for me a minute ago. The procedure is to open https://globalwindatlas.info/ select your location click the download button (down-arrow icon) in the top-right corner just under the main menu bar select GWC hit the download button in the GWC window make sure that the map in you WAsP project has a proper map projection right-click the WAsP object where you want to insert the downloaded GWA file hit insert from file> generalized wind climate from the popup-menu say OK, when WAsP asks whether to insert barometric reference data Alternatively, with the latest WAsP 12.8, you might insert an interpolated GWA directly make sure that the map in you WAsP project has a proper map projection right-click the WAsP object where you want to insert the GWA hit insert from global wind atlas> generalized wind climate from the popup-menu
-
How to calculate RIX0.04 (Regarding IEC 61400-12-2)
Morten replied to NYKim's topic in Windfarm Assessment Tool
Hi Kim, The dZ values for the RIX number evaluation in IEC 61400-12-2 are calculated by terrain elevation at points distributed with 30m separation along the centerline of each 10 degree sector. The dZ values are defined by elevation differences of neighboring points, and the slopes are the elevation differences divided by the point separation (30m). This measure is not related to the distance from the turbine, so I am not sure the conversion you suggest will makes sense. The RIX number evaluation depends on a threshold, which is scaled by H+D (hub height plus rotor diameter) and we evaluate a RIX value by several thresholds. There is an explanation in the WAT help file section IEC 61400 standards>IEC 61400-12-2>terrain assessment but it is very brief, so I recommend that you read section 6.3 of the IEC 61400-12-2 standard for a full explanation. -
We now have a ME version 12.4.10.74, which is able to import GWA map data. You can download it from https://www.wasp.dk/download/wasp12-suite-installer.
-
Hi Andreas, Please send the *.wat project file in the state just before this error occurs to waspsupport@dtu.dk. It might also be good to send a screen dump to show the selected display options above the table. BR Morten