Morten
-
Posts
214 -
Joined
-
Last visited
Everything posted by Morten
-

Licencing requirements for WAsP 12 (Version 12.10.18)
Morten replied to KESHAV007's topic in Installation and licencing
I saw your post Downloading WAsP 12.7 version - WAsP - WAsP Forums and added my reply there. You should also receive an email from me. -
I just sent you an email to the address in your WAsP forum profile.
-
We deliberately removed download links to earlier versions because we only offer technical support for the latest version. My first suggestion would be to ask the client why they insist that you work with WAsP 12.7. Maybe they think this is the latest version, or maybe they are sceptical about a specific model improvement and want to revert to an earlier model approach. In many cases, this is still possible via the program options
-
Licencing requirements for WAsP 12 (Version 12.10.18)
Morten replied to KESHAV007's topic in Installation and licencing
We changed our licence system to a yearly subscription, which always allows you to download the latest version of the WAsP suite from WAsP - Download. This page also contains links to release notes, so you can check whether new features or bug fixes are likely to affect your current work. If you need technical support at some point, we will typically ask you to try the latest version before diagnosing technical problems. So it is a good idea to stay updated. -
USE of WAT to calculate Plant Power Curve
Morten replied to KESHAV007's topic in Windfarm Assessment Tool
WAT can both calculate power curves for a group of turbines or an entire wind farm, see video no. 17 in the playlist https://panopto.dtu.dk/Panopto/Pages/Viewer.aspx?pid=ac6b3bd1-7349-4ffc-8c86-af7300f4bae8 If your main interest is AEP and not site assessment, then it is easiest to model your project in WAsP than in WAsP Engineering. For this, you set up a WAsP project, export the WWH file and import it in WAT using File>New>Import WAsP project. -
I just checked with our main programmer, and your observation is correct. The main programs are unchanged; the only difference is an update of the WAsP CFD calculation manager.
-
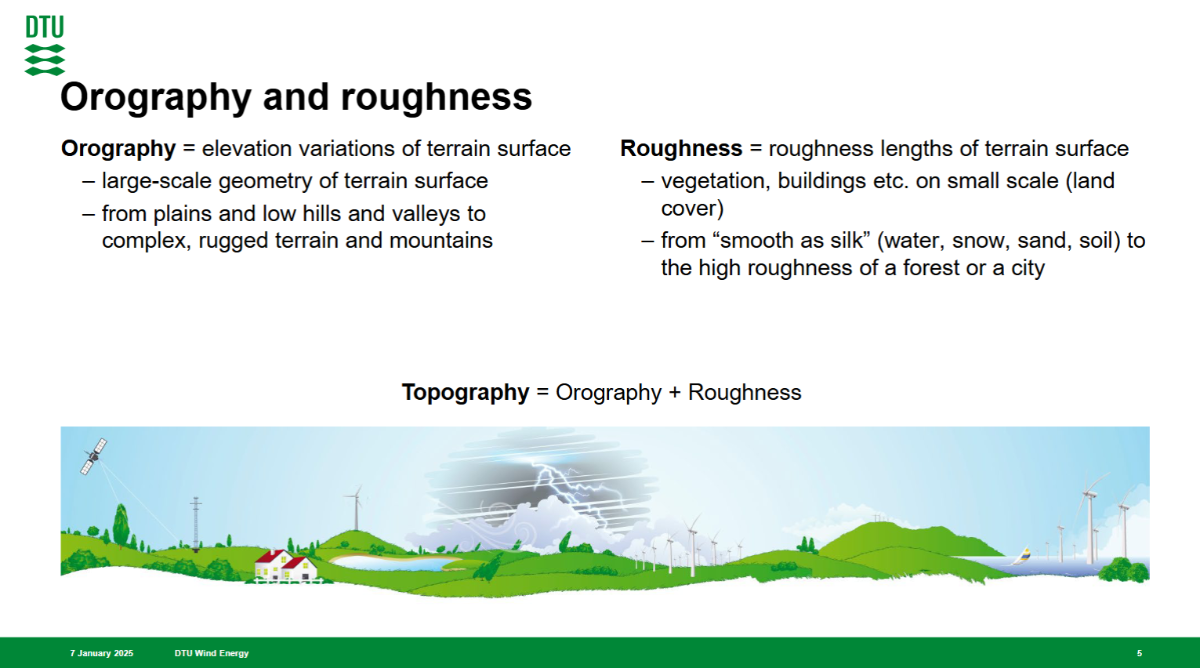
Hi Gyengil, The quoted text about the flow model makes sense when familiar with our terminology. I found the slide below from one of our DTU courses for regular students. As you can see, we consider topography to be the combination of terrain elevation and surface roughness. Still, it does not include obstacles like buildings and shelterbelts. In the built-in model, orography is modelled by IBZ, whereas effects of surface roughness changes are modelled independently by the IBL model. However, with WAsP CFD, both orography and roughness changes are included in the CFD model.

-
BZ is an abbreviation of Bessel Zooming, and IBZ refers to the same model. I am unsure why my colleagues started calling the model IBZ - maybe it was just a way to honour the author, Ib Troen. I think the roughness map affects the WAsP-CFD flow model, and I will check with the main developer, Andreas Bechmann, next time I meet him.
-
Answer 1 – The forest model in WAsP-IBZ uses the displacement height concept. It should also be possible to implement that method in WAsP-CFD, but we have not done that yet. I guess my colleagues involved in the development project were worried about the lack of data for model validation and maybe also felt that the combination of forest and complex terrain might be too difficult to handle correctly by the displacement height approach. Read more on this difficult topic at https://link.springer.com/article/10.1007/s10546-020-00564-3 Answer 2 - Obviously, the missing support for forest modelling in WAsP-CFD raises the question of the best procedure for forest on top of complex terrain? This is a difficult question and it probably has no universal answer. If the forest is uniform, you might correct measurement heights and turbine hub heights for the expected displacement height, but I cannot guarantee it will work. Try to test the method by cross-predictions between measurement masts. Answer 3 – The obstacle shelter model in WAsP is independent of the flow model. Thus, it works the same way with either IBZ or CFD.
-
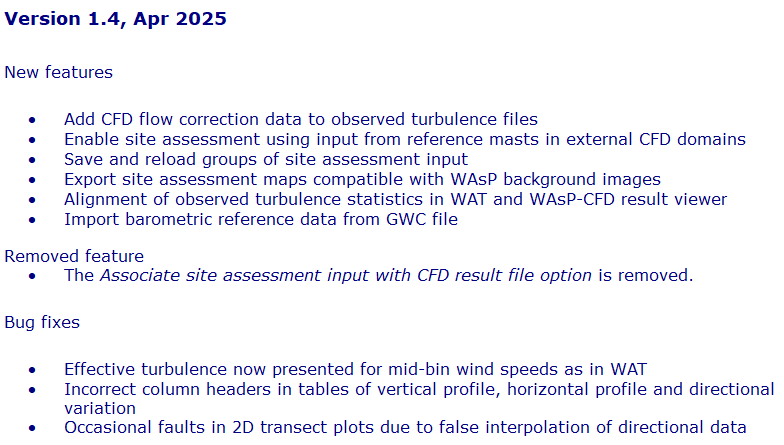
I Gyeongil, We plan to release a new version soon; I have attached a list of the main changes below. I expect that the bugs you mention have been fixed. There will be an announcement at WAsP.dk, and I shall also try to post here when the release is ready. DTU closed the file server holding the sample data. My remaining task is to find a new home for this data and update the links from the help file. I do not plan to update all video demonstrations, but there will be a new help file. Best regards, Morten
-
Prepare data for WAT: cannot read files (version incompatibility?)
Morten replied to Guilherme's topic in WAsP Engineering
WAT needs a mixture of results from WAsP and WAsP Engineering, so the Prepare data for WAT tool asks for additional input files. We added some improvements to the WAsP model, which required an update of the GWC file format. This is the reason why the current software distributed by WAsPSuite-2025-A-12 has problems reading the GWC file produced by WAsP 11. The way to proceed is to generate a new GWC file by WAsP 12, which is included in WAsPSuite-2025-A-12. I think you can open the original WAsP 11 workspace file (WWH) by WAsP 12, recalculate the GWC object, and then save that in the new file format. If I remember incorrectly, or if you simply lost the WAsP 11 workspace file, you will need to construct the workspace by WAsP 12 using an observed mean wind climate (OMWC) file. -
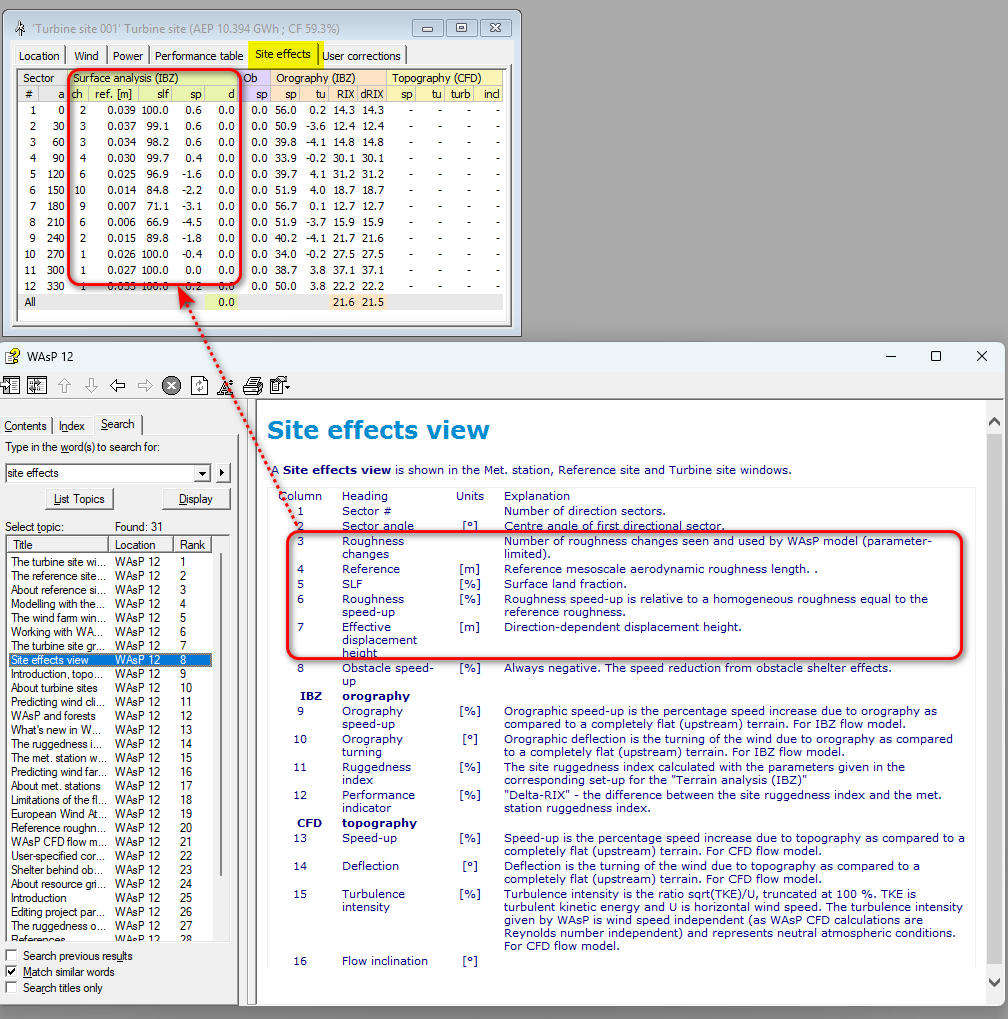
The roughness rose will cover the same area as the user-supplied map out to a radial distance of 30 km. It replaces the detailed roughness patterns of the real map. The European Wind Atlas explains how the roughness values in the sector segments are calculated. As you learnt in the WAsP course, the provided map must include a margin around any site of interest equal to 100-150 times the hub or anemometer height. For each sector, the flow model assumes a wind profile based on the far-upwind reference surface roughness, and this basic profile is corrected by internal boundary layers. You can see this in the site view>site effects view. The roughness rose is still used inside the model, but the developers choosed to remove it from the WAsP 12 user interface. I sometimes miss it for pedagogical reasons.
-
Correct, all turbines' wake model parameters are uniform, but you can modify wake-decay parameters for individual sectors.
-
Your colleague is right. WAsP simplifies the detailed surface roughness map to a local polar map around each site of interest. We sometimes call this simplified map a roughness rose, and it has common roughness values within each sector and fewer roughness changes in the radial direction. The original roughness-simplification method is described in chapter 5 of European Wind Atlas - DTU Findit around page 81. The method may have been updated later, but the principle is the same. The maximum radius of the roughness rose is something like 30 km. We recommend that the map prepared by QGIS has a margin around any site of interest equal to 100-150 times the hub height or anemometer height.
-
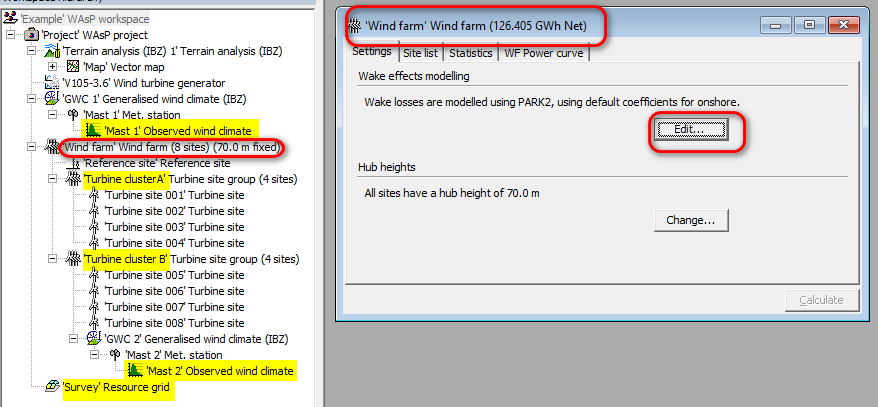
Hi Gil, The WAsP wake model applies global parameters for the entire wind farm. Right-click the main turbine site group and click the 'Edit' button to modify them. You can use the observed wind climates for two masts if you arrange the WAsP project as in the attached screen dump. Here, I inserted two nested turbine groups as child objects to the wind farm and sorted the turbine sites for their most representative met mast. I inserted two wind climates, one for each mast, and attached the second wind climate to the second sub-group. In the screen dump, Turbine cluster A is modelled by Mast 1 while Turbine cluster B is modelled by Mast 2. The WAsP flow model may not cross-predict from one met-mast to another correctly, especially if the terrain is complex and RIX numbers differ. Furthermore, be aware of the risk of mistaking annual wind climate variations for spatial variations if the measurement periods of the two met masts differ. Regards, Morten
-
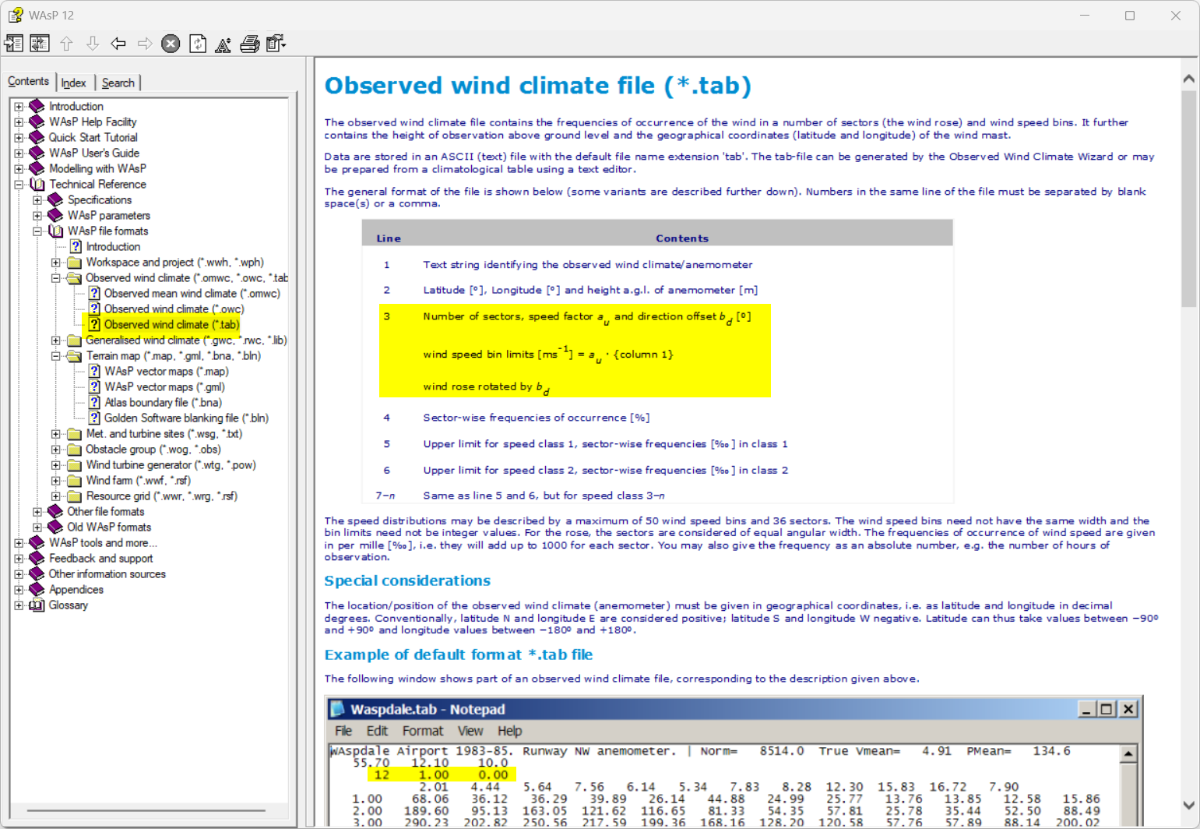
The standard way to generate an observed mean wind climate file is to use the WAsP Climate Analyst tool. By default, this program will export to the OMWC file format, but you can also select the old TAB file format. To write a TAB file without the Climate Analyst, you will need to check the format in the WAsP help file section Technical reference>WAsP file formats>Observed wind climate>Observed wind climate (*.tab)
-
I see a mail address in your profile and will use that for continued discussion.
-
The error message suggests a problem connecting to our database. I am not sure why but you could try again another time, from another Network or from another PC. I made a small demo to illustrate the process, see https://panopto.dtu.dk/Panopto/Pages/Viewer.aspx?id=a8c6d653-53b5-4bee-8208-b21700925271. Note that I insert a turbine site before downloading the GWC to help WAsP finding the location of the process.
-
We updated the wind climate models and the new model parameters are not supported by the old LIB file format. If you need a LIB file for a special purpose, you must recalculate the GWC without the new model options before you can export it to file. Follow this procedure: Right-click the GWC and select Show GWC from the popup menu. Open the Stability panel and select the old EWA profile model from the drop-down menu. Open the Geostrophic shear panel and hit the Turn off button Close the GWC and recalculate it Right-click the GWC and select the Export GWC to legacy format option from the popup menu. For WAsP calculations, we definitely recommend GWC calculations by the updated model and export to the new GWC file format. Maybe you can seek advice from the WindPro developers about the best workflow for their program. Best regards, Morten
-
The WAsP week 2024 is a three-days WAsP course followed by two days of workshops. You can learn about our ideas for workshop topics at WAsP Week 2024 open for registration, but we are open for your suggestions too. Do you have a topic, which you would like us to discuss in depth?
-
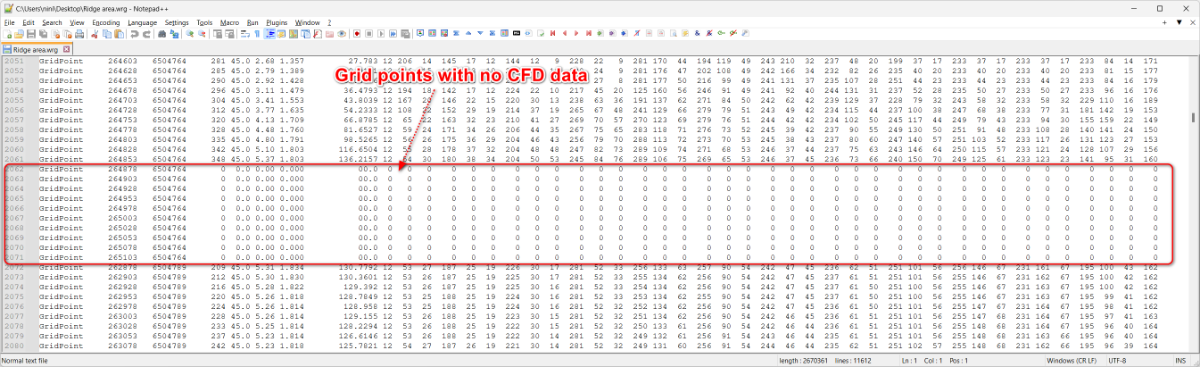
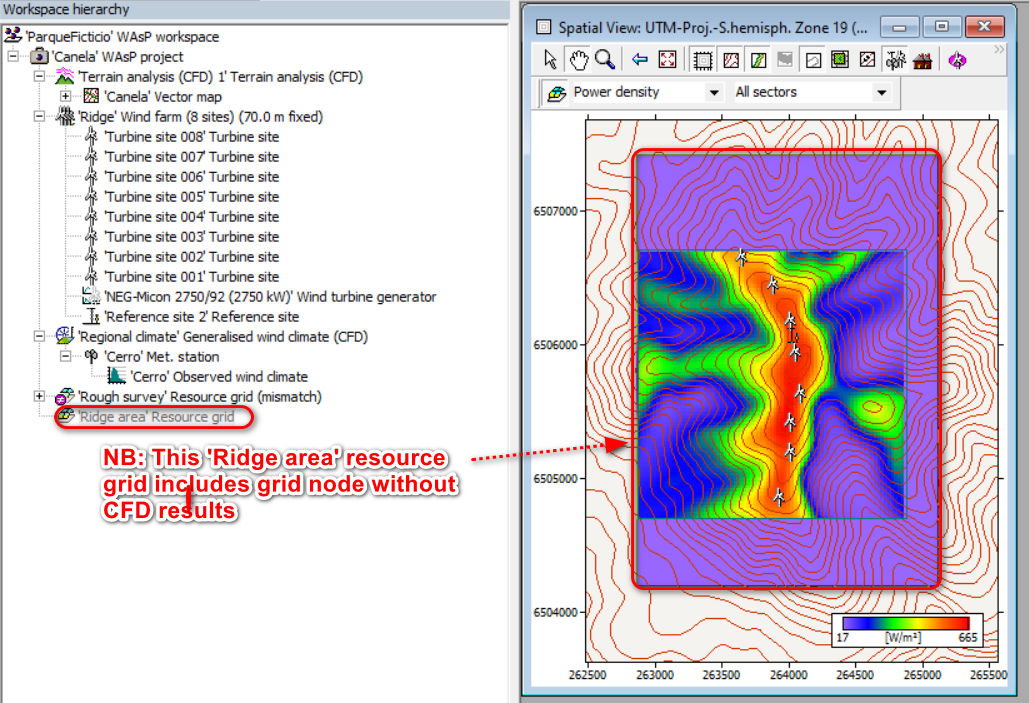
Hi Pablo, The Terrain analysis (CFD) window can optimize this mosaic to cover all turbines and met stations by a minimum number of 2x2 km tiles. As you say, this will normally not result in an area of a rectangular shape. WAsP allows you to generate one or several resource grids, and they may include areas with no CFD data. To see how this work, we can open the ParqueFicticio workspace, which is part of the WAsP sample data normally stored in ..\Documents\WAsP samples\WAsP 12\Wasp, import the associated CFD data and create a resource grid, which is larger than the area covered by CFD calculations as in the first screen dump below. If we export this to a WRG file, that file will include the grid nodes without CFD data and report zero in all result columns, see second screen dump. I do not know how Windfarmer will react to a WRG file containing lots of zeros. To learn about best practice for CFD results in Windfarmer, I suggest that you consult the Windfarmer documentation or ask for their guidance. Good luck with your project!
-
Translating observed wind speeds to turbine locations in bulk
Morten replied to Heather's topic in WAsP Engineering
Hi Heather, The wind speedup and deflection script in WAsP Engineering provides a simple lookup table, which you can use to correct an observed time series observed at a reference point to the conditions at a turbine site and maybe another height above ground ground level. We made this script a long time ago supporting people who wanted to work with alternatives to the annual-maximum method, which in those days was the only extreme-wind estimation method in WEng. In principle, you could correct your time series by the lookup table of the WEng speedup and deflection script and use it for other purposes, but be aware that the WEng flow models focus on extreme wind conditions and does not include stability corrections. The built-in standard model of WAsP (IBZ) and WAsP-CFD are more suited for prediction of energy production. When correcting a time series by these models, you must consider possible differences in upwind flow profiles and apply the geostrophic drag law. As mentioned above by Rogier. -
Hi Kwak, The error handling in WAsP software is implemented by try…except statements, see this site for explanation of the concept. When the computer is asked to do something impossible, it stops execution and raises an exception which the program can react to. There is also a basic message like “divide by zero”. A programmer which foresees all problems and spend sufficient time on error handling, might add comments like “Undefined hub height of Turbine no. 001”. However, most subroutines in the programs just raise a new exception and append more information about where the problem occurred. Subroutines can call each other in a long chain, so you often see a complicated message in the final report including information from all nested sub-routines. It is not particularly helpful for the end user, but it explains the fundamental error type, approximately where in the program the first exception was raised, and the last action in the user interface. Still it may not always enough to diagnose the problem, so we often ask for additional information like A test project file reproducing the problem A description of what you were trying to do, maybe supplemented by screen dumps A WAsP installation report You can save time if you include such information already the first time you contact WAsP support.
-
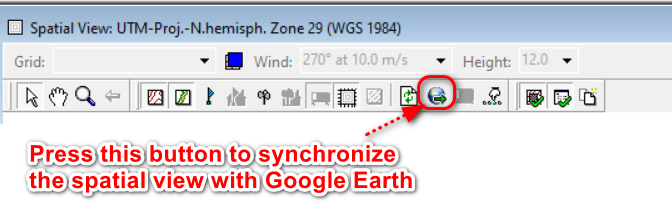
The two most common problems with the SCM tool are The SCM server providing the long-term reference data might be down. However, I just checked and it worked OK this afternoon. If the coordinates of the reference mast or the map projection are incorrect, the SCM server might not find the data, e.g. it if the false position is in the middle of an ocean. The easiest way to check the mast location is to open a spatial view, synchronize with Google Earth (see below), and make sure that the map is displayed correctly on the virtual world. If these simple explanations does not apply, then please contact our technical support system via mail. The above error message might be enough for the programmer to understand the issue, but please also describe your actions just before the error message arrived. Screen dumps and a sample project file demonstrating the problem are also useful and sometimes even necessary. In general, it is usually better to contact the support system about specific technical problems and reserve this forum for discussions of interest to all users.
-
Map Editor truncating map extension on ocean side?
Morten replied to Pablo Faúndez's topic in Map Editor
I was testing my above method and need to correct myself. It seems like the map editor does not save information about the adjusted map size to file. so I guess thise merely was intended as a way to enlarge the 'canvas' while 'painting' roughness-change lines and elevation contours manually. In most cases you can use the methods inside WAsP and WAsP Engineering as described in my post above, but not for the Prepare data for WAT tool inside WAsP Engineering. The trouble is that this tool will ask you for a WAsP vector map file and then do some WAsP calculations for mean wind climates. As you can imagine, this can fail if the map does not include an offshore wind farm. A work-around method is to open the map in the map editor adjust the map size to include the wind farm create a dummy roughness line as a polygon surrounding the offshore wind farm specify water surface roughness both inside and outside that polygon. Load the map with the amended map into the Prepare data for WAT tool and its WAsP calculations should work without problems.