Rogier
-
Posts
50 -
Joined
-
Last visited
Everything posted by Rogier
-
That probably means that somehow you have invalid geometries. You can find them by running Vector > Geometry tools > Check Validity. This will generate three layers with valid, invalid and errors. Running the script on the valid output instead of the original layer that you used as input should work. Usually invalid geometry result from cropping very small areas near the border. If that's the case you can safely proceed with the valid layer. If not, you may have to edit your layer and make sure it is valid. I would also download the latest version of the QGIS plugin as there have been some bug fixes and updates: https://data.dtu.dk/articles/software/Using_QGIS_to_create_WAsP_maps/20495178
-
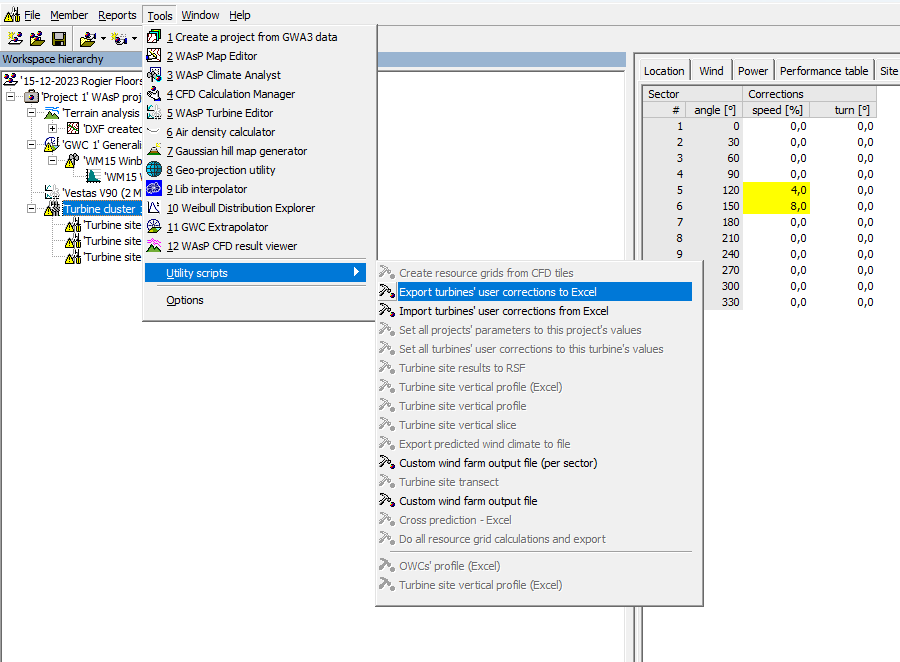
Hi, I am not sure if I understand correctly but if you select you wind farm there is the option the export and import from excel: You will have to save it as a "old fashioned" .xls file for this script to work though (in excel I mean).

-
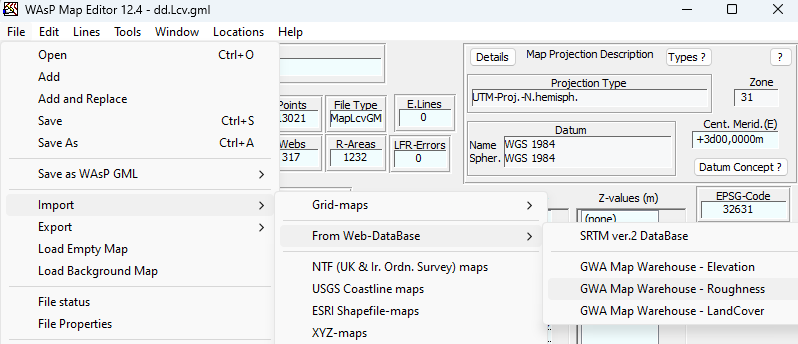
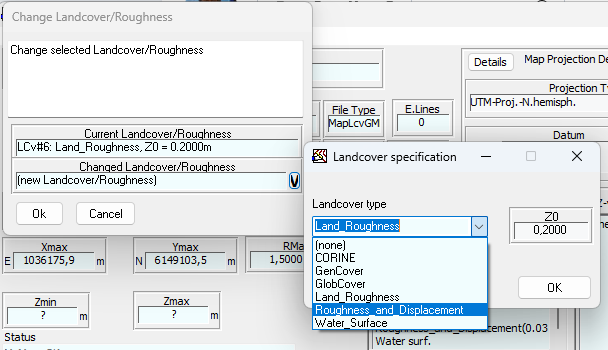
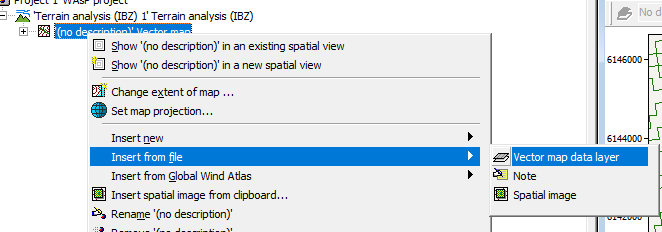
From what you describe it seems like what you are trying to should work. I personally would usually use the QGIS plugin for doing this. You can download the plugin here; https://data.dtu.dk/articles/software/Using_QGIS_to_create_WAsP_maps/20495178 The video for working with displacement you can find here: https://panopto.dtu.dk/Panopto/Pages/Viewer.aspx?id=fd8f16a9-9cee-4644-a71e-b09200ad6533 Other videos to get this point are listed here: https://panopto.dtu.dk/Panopto/Pages/Viewer.aspx?pid=027e510f-32e6-473d-b96c-b0d800dddc2e 1a/b : then pick "Edit > Change landcover" and assign a roughness and displacement height to a certain landcover. Hopefully you can save this a gml. 1c: I would just keep them seperate and add them as seperate "vector map data layers": 2: The spider grid analysis is the default model since WAsP 12.7 so you don't have to do anything extra for this. The landcover table is not something you have to generate yourself neither, as it just made by the map editor/QGIS when you save the file as GML. It is embedded in that file. 3/4: Also this is just done automatically since WAsP 12.7. It will add the displacement heights from the landcover map to the orographic map in the program itself. In the video I linked I think there is towards the end a part where you can see it in WAsP where the displacement height shows up in the ´site effects´ tab.
-
Hi, no everything 'old' should work as expected: you will just have to specify a correct position using a georeferenced map. What do you mean with the form not working?
-
No with the introduction of new features related to profile modelling and stability it is not possible to export as .lib file anymore.
-
A location is now required for your GWC file, perhaps it is related to that. The newer version of WAsP requires a location to retrieve relevant meteorological variables around the site of interest to calculate the air density and the atmospheric stability. If you want a more definite answer, you can share your workspace by attaching it here or by writing to support: https://www.wasp.dk/support
-

[WindKit] Timeseries to binned wind climate
Rogier replied to Nils Joseph Gaukroger's topic in WAsP Python tools
Ah ok, yes I see you are right about the default path being the current working directory. Yes, the error you have discovered can occur in more places in windkit. Whenever you find that error you can fix it by using positional arguments instead of named arguments for the first argument (e.g. `bwc` instead of `bwc=bwc`) -
[WindKit] Timeseries to binned wind climate
Rogier replied to Nils Joseph Gaukroger's topic in WAsP Python tools
Hi Nils, The only thing I had to change in your code is: # Create binned wind cliamte from timeseries bwc = windkit.bwc_from_timeseries( DS ) # Create .tab file from binned wind climate windkit.binned_wind_climate.bwc_to_tabfile( bwc, "/home/rofl/test.tab" ) But I agree what you are doing should also work (the ts=DS part), so I have reported it as a bug. In the last function you have to specify the path. Cheers -
Hm, then I am really not sure. Perhaps the URL is not accessible for you somehow. Can you access the URL "esa-worldcover.s3.eu-central-1.amazonaws.com" directly?
-
I looked at your polygon and the first problem is that it is in a geographic coordinate system. So you will have to reproject to for example a UTM projection. Another problem is that ideally your bounding box should be rectangular so we can crop the boundary lines. I recommend to use the newest plugin that I uploaded: https://data.dtu.dk/articles/software/Using_QGIS_to_create_WAsP_maps/20495178 There is a new script included where you can create a bounding box from lat/lon and a option to download worldcover data. I have also updated the instruction videos.
-
Yes, you can either attach it here or send it to the support: https://www.wasp.dk/support
-
Yes there is no height and roughness classes there, but I don't think this is what WindPRO is using. This code is in beta and has not left DTU as far as know. Regarding your other questions: the problem is that the observed wind climate is valid for a certain roughness and height, so if your output location is not for exactly that location you will need more information about what the wind climate is for other heights and roughnesses.
-
Could you sent me the polygon that you are using? Because I can't reproduce the error.
-
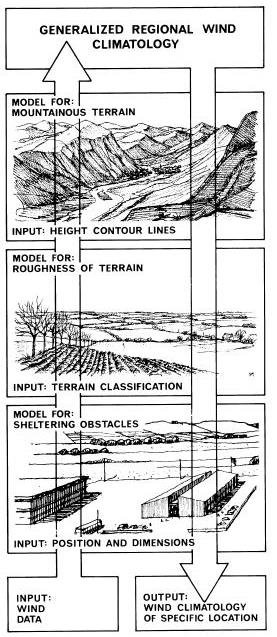
Hi David, these are some good questions. Since some of these decisions were already made when WAsP was developed for the first time (80s/90s) and I have been at DTU only since since 2010 I can only give you my best guesses. 1) The generalized wind climate can be considered as a lookup table for the wind climate conditions. Typically, the workflow would be that you have one mast that you convert to a generalized wind climate and apply it to many turbines positions or a many points (resource grid). Therefore it computationally it make sense to do the transformation to a generalized wind climate only once. For all turbine positions or points in a resource grid we then only have to do a lookup in the generalized wind climate and not reprocess the whole histogram. Technically, the input histogram is actually first converted to a geostrophic wind climate (using the geostrophic drag law) and the the down transformation is continued (see page 585 here: https://backend.orbit.dtu.dk/ws/portalfiles/portal/112135732/European_Wind_Atlas.pdf ). But you could also continue from the geostrophic wind climate straight to the output locations, thereby removing some of the small interpolations errors that are made when interpolating the generalized wind climate. There is some code for doing this that we may introduce in the future, but it is not available in the WAsP GUI, also because the interpolations errors are typically very small. It is also easier to compare wind conditions if you have some standard heights and roughness you can compare with (as is done in the original european wind atlas tables). So in other words, the generalized heights and roughness are not strictly required but just a model choice that were made at some point. 2) The generalized wind climate is already 'cleaned' for effects of stability so these will not have an impact. So if your input wind climate, height, location (comes in via the coriolis parameter which depends on latitude) and stability for the generalization is the same and the wind climate at z0=0.1 and h=10 m is the same, all other heights and roughnesses should also be the same. 3) The main rules of thumb related to the generalized wind climate are to set the height of your observations and prediction close the heights of the generalized wind climate. Like that there will be minimal interpolation errors related to heights. Typically the generalized roughness classes interpolation errors are harder to avoid, unless the roughness length at your site is the same for all wind directions. If there are differences in roughness, you can set them so that the roughness length classes span the mesoscale roughnesses that are observed in your observed wind climate and your predicted wind climate. 4) The only literature that described the generalized wind climate procedure (as far as I know) is the European wind atlas itself (mostly around page 585). Some details may be different in the code that is currently in WAsP though.
-
You don't have to add any URL anymore. The videos correspond to a slightly older version of the plugin. The only thing you have to do now is make a scratch layer with a single polygon and use that layer as an input "Clipping layer" to the script "Get WorldCover landcover polygons". The resolution is limited to 50 m because otherwise the maps get too large and become very slow in WAsP.
-
Hi, I guess you are trying the do something similar as the user here: I.e. using WRF model output as input in WAsP and then doing a dowscaling. WAsP is designed for working with measurements so what you are trying to do is difficult and not a recommended work flow. It would be better to use the generalized wind climate that are generated from NEWA directly, but these are unfortunately not available online. I will ask a colleague if and when we can make these available. Until then, it is better to use the global wind atlas import functionatility in WAsP, which does this process for you (i.e. downloading nearest generalized wind climate). The global wind atlas is also based on WRF simulations with ~3 km resolution, just like NEWA.
-
The difference between MWh (free) and MWh (Park 2) is that the first one does not calculate wake effects (effect of one turbine on the other) and the second one calculates these effects using the Park2 model (see e.g. here: https://orbit.dtu.dk/files/151671395/Park2_Documentation_and_Validation.pdf). The efficiency in each sector is the AEP in MWh using the Park2 wake model divided by the AEP without considering wake effects (but in percent).
-
The process you are doing with the map editor is a bit tricky because as you have noticed it can result in roughness consistency errors. The safest way is to use the "Get WorldCover landcover polygons" in the QGIS plugin you refer to. It should make a valid polygon map for you and if you then convert the polygons to roughness lines (as required by WAsP) it should not result in any errors. The error that you get indicates that you using a clipping layer that exists of more then 1 feature. The script extracts only data from a single polygon. You can make that following the instructions in the this video (from minute 3:15, i.e. digitize a point in a scratch layer with the correct metric projection and buffer that point with the desired distance).
-
This is just a guess without having the file, but you will need more measurements more than once a day to make a histogram wind climate for WAsP (typically every 10 or 30 min). The WAsP method may not work when you use measurements (model output?) that are available only once per day. So I would not recommend it, but you could probably solve the error by adding a time stamp in your date column.
-
How to extract vertical wind profile from Wasp to excel?
Rogier replied to Petar Dundović's topic in WAsP
Hi Petar, all the utility scripts from WAsP are in the folder: C:\Program Files (x86)\WAsP\Internal scripts\WAsP You can edit the lines in the script there or make your own custom script. If you changes these lines in the script "Turbine site vertical profile (Excel)" (also attached): If LastHeight > 200 Then LastHeight = 200 End If If you are not able to edit that folder due to permissions you can copy the zip file "WAsP 12 standard scripts" and put it somewhere in your home folder and set the folder where WAsP is looking for the script to that folder (Tools > Options > Files and paths). Rogier Turbine site vertical profile (Excel).was9 -
Hi Omer, your code is nearly working. The only part that is missing is assigning the coordinates and the crs (coordinate reference system). If your site has latitude=56 deg N and longitude=10 deg E and is at 100 m above the surface, you could do something like this: DS = DS.assign_coords({"west_east":10,"south_north":56,"height":100.}) windkit.add_crs(DS, 4326) # Windkit binned wind climate from timeseries bwc = windkit.binned_wind_climate.bwc_from_timeseries(DS, ws_bin_width=1, nwsbin=35, nsec=12, normalize=True, crs=None) The `add_crs` function adds the coordinate reference system, in this case a geographic coordinate system which is denoted with the EPSG code 4326. If you use another coordinate system you can find the corresponding code usually here: https://epsg.io/ or you can create you own `crs` object using the pyproj library, which windkit relies on for projections.
-
Hi Lidia, For your specific case you might also look at the QGIS scripts we have made for handling WAsP maps. QGIS is open source software and used for many GIS applications. The WAsP scripts plugin has a specific script "Polygons to roughness lines" that does the step from polygons with a single internal roughness length to a left and right-hand size roughness length, which is the format that WAsP expects. You can find some materials (incl. a video) here: https://data.dtu.dk/articles/software/Using_QGIS_to_create_WAsP_maps/20495178
-
What I actually meant to say was "the vertical profile models are different": Vortex and their models will give you one vertical profile model, WAsP will given you another one. For the last profile model I can give you some numbers: for typical vertical extrapolations between 20 and 200 m you can see some results of the WAsP model here: https://www.wasptechnical.dk/forum/topic/687-validation-report-wasp128/ So vertical extrapolation errors are typically around 1-2% on wind speed using the latest WAsP (the report above also contains horizontal extrapolations which have larger errors). This is only under best model set-up conditions where you use measurements as input. Whether you trust the vertical profile model of Vortex more than WAsP depends on your site. There is large uncertainty on the data from vortex because they are from numerical weather prediction models for a coarse resolution (1 km? can't really judge what model it is from your message). They typically also switch off parametrizations to make it run faster I think. You may be able to get a generalized wind climate that is independent of height by obtaining the roughness, elevation and atmospheric stability information from Vortex, but even when everything is setup perfectly it might still not match, because you are mixing two models. In other words, if you trust the vortex vertical profile model I would use the 135 m hub height, if you trust the WAsP vertical profile model you will have to pick your 50 m height as input :) I would say definitely use the 135 m output, simply because you don't have the materials to setup a model chain here to make WAsP perform well (i.e. roughness map, elevation map, stability info from mesoscale model + the same for microscale modelling). If you had measurements and good model inputs, I would trust the WAsP method more than Vortex.
-
Hi Andreas, WAsP will try to clean your input .tab file from local effects and then apply local effects where you do your prediction. If your input height is different your are not guaranteed to get the same generalized wind climate out, simply because the vertical profile models are imperfect. Only when you use a fixed height and let WAsP (with stability set to neutral) and calculate at some heights it will be a log profile. You would also need different roughness and elevation maps and stability info from the WRF simulation for your generalization step. So in other words, you can't easily use WAsP this way to downscale WRF results..
-
Mesoscale coordinates to lat/long?
Rogier replied to Julian Moore's topic in New European Wind Atlas
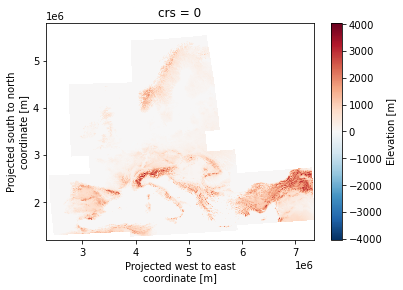
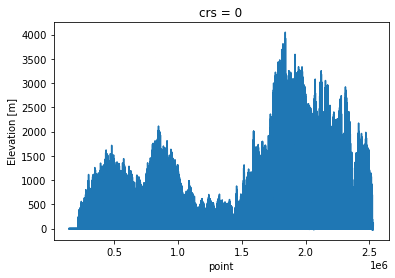
You could use the windkit package (pip install windkit) to convert to latitude longitude using the function reproject. However, it won't be a raster anymore because the coordinate spacing varies in both south-north and west-east. So you can only plot it if you keep the original projection, which is given in the variable "crs". import windkit as wk import matplotlib.pyplot as plt import xarray as xr test=xr.open_dataset("/home/rofl/newa_elev.nc").set_coords("crs") test.elevation.plot() test_latlon=wk.spatial.reproject(test,"EPSG:4326") test_latlon.elevation.plot()